
At IAM RoadSmart, we aim to inform members of the motoring and riding community, fleet managers and external organisations about the importance of road safety. We do this by producing different resources that inform and educate on the latest policy changes.
We also offer tips, advice, and general guidance to support making the roads a safer place. On this page, you will find a variety of resources explaining different areas of road safety. This includes The Highway Code, alongside tips to help you improve your driving and riding.
The below statistics are from the Department For Transport's annual report surrounding road traffic accidents and casualties. This report was released in September 2023 for the 2022 period. We update this page on an annual basis as new reports come in.
Overall statistics
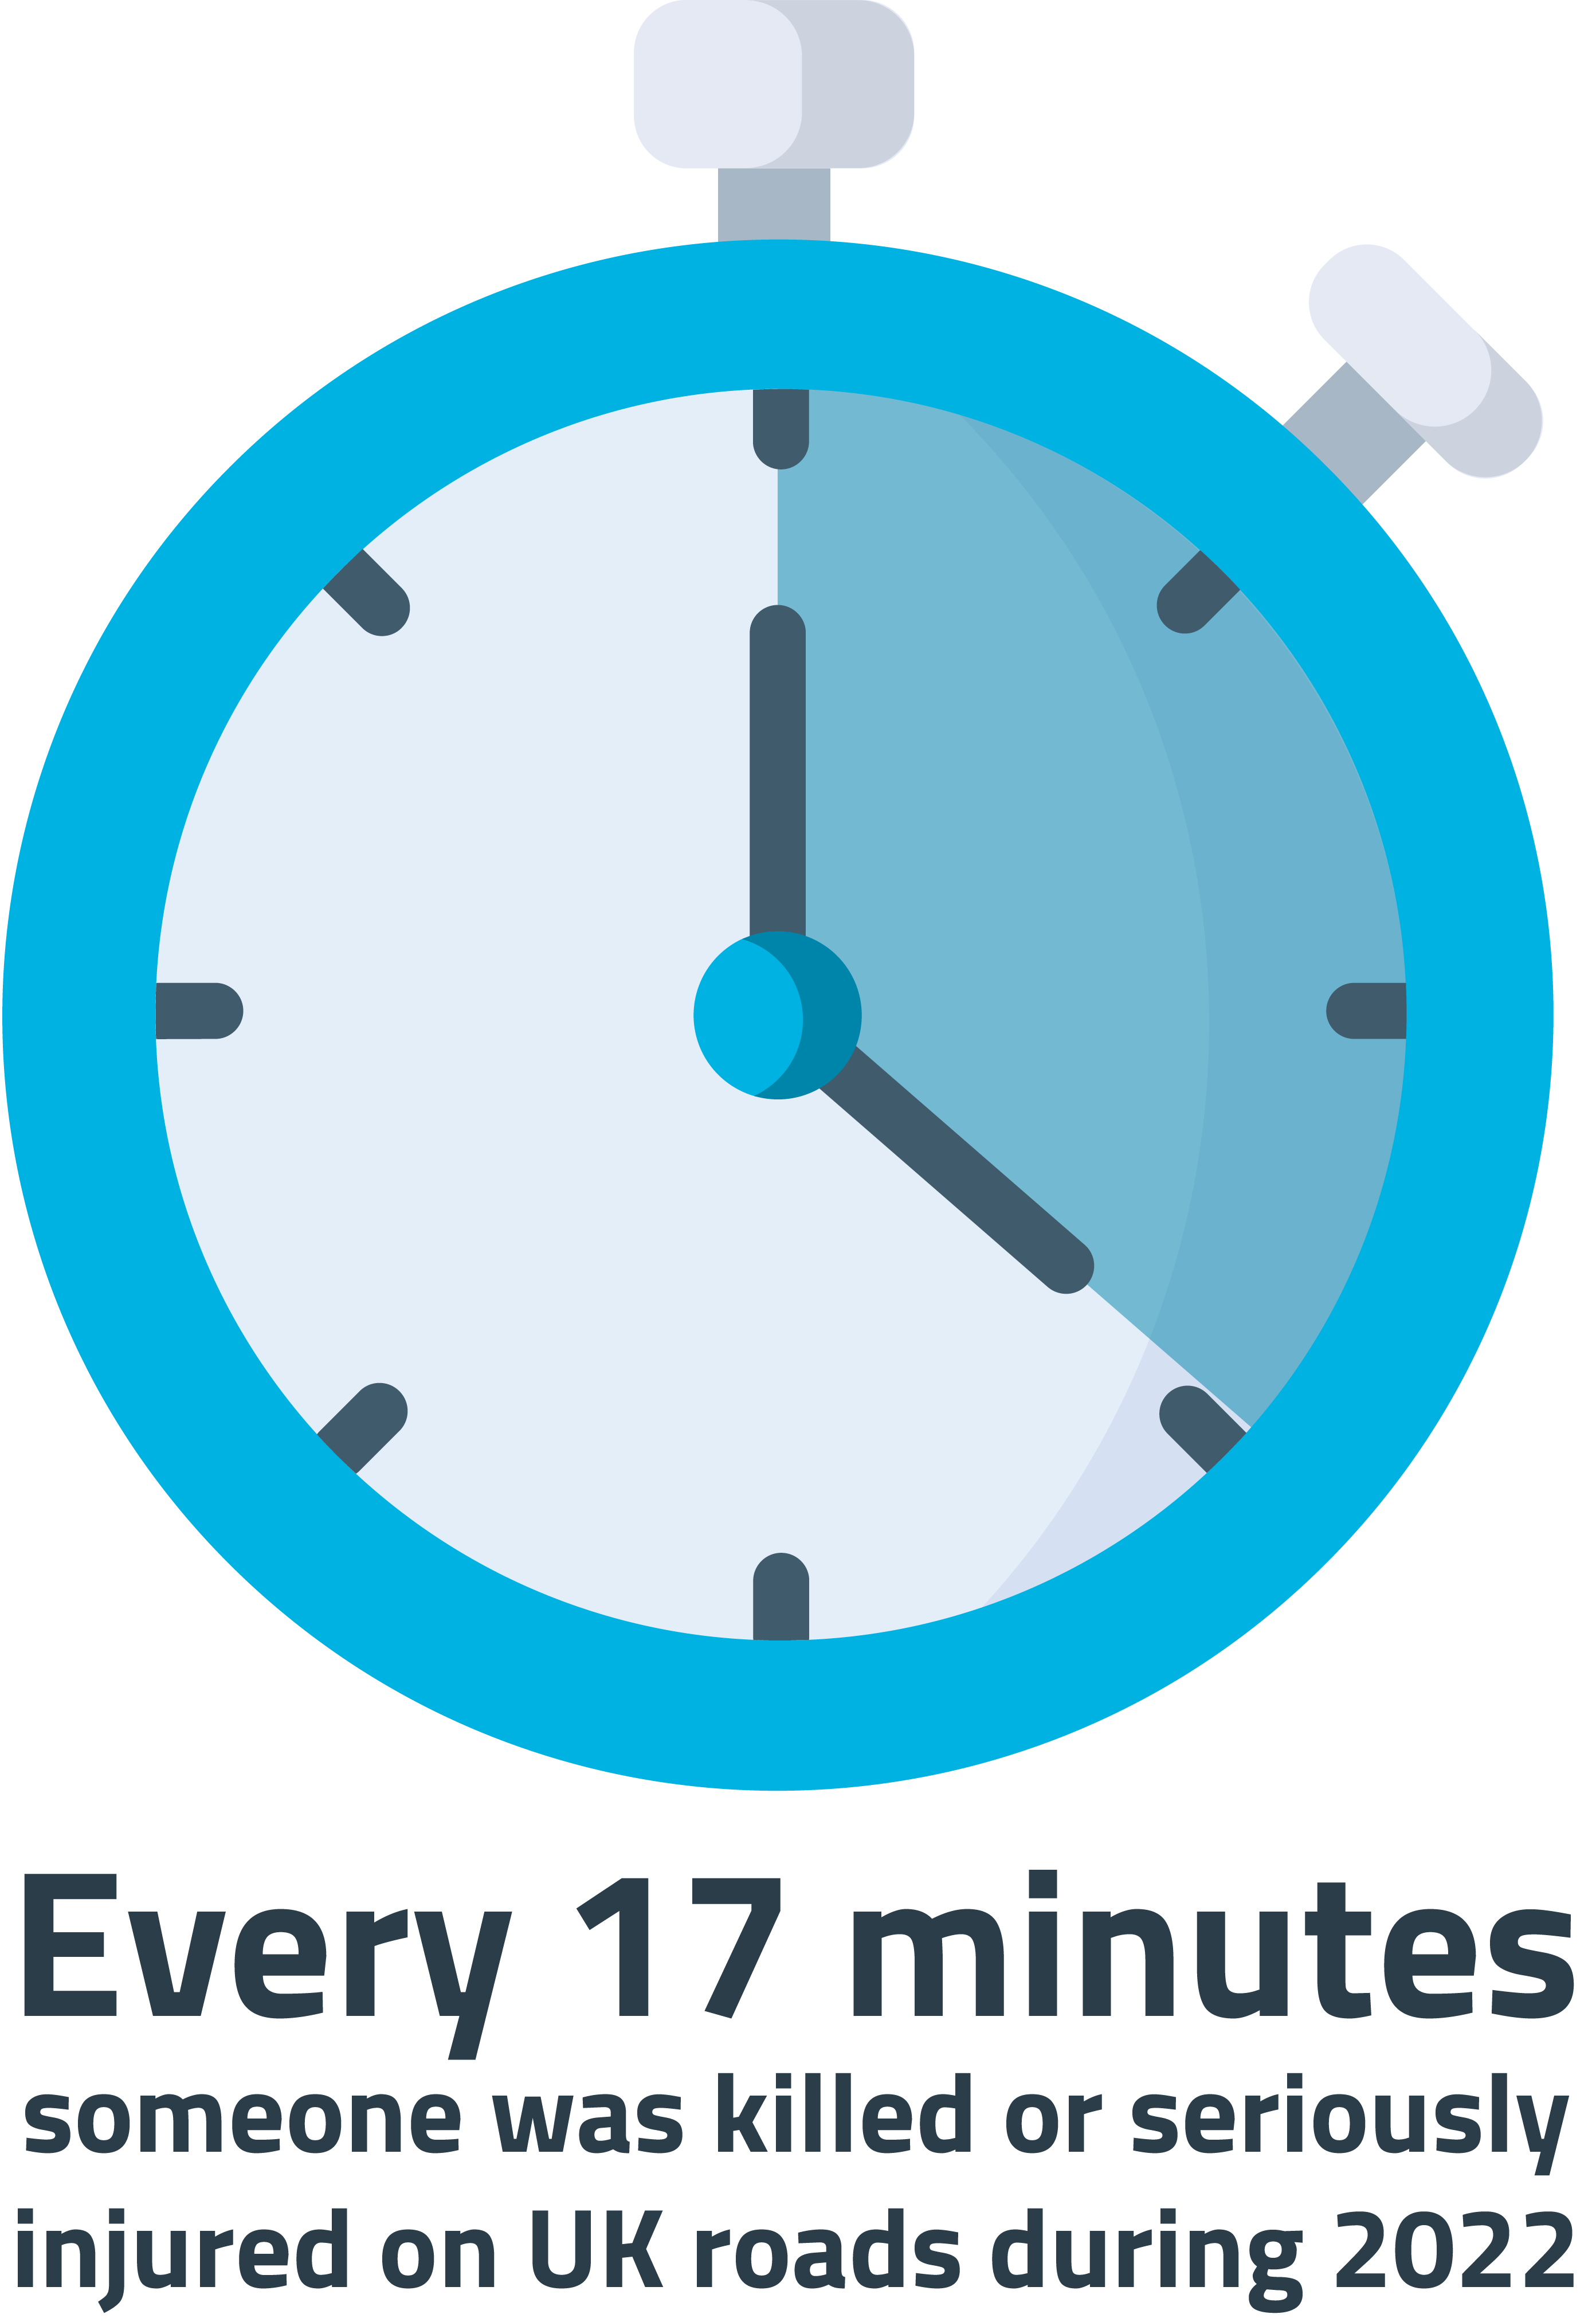
In Great Britain in 2022 there were 1,711 fatalities, a 10% increase on 2021 but a decline of 2% compared to 2019. 29,742 killed or seriously injured (KSI) casualties, an increase of 10% compared to 2021 but a decline of 3% compared to 2019. 135,480 casualties of all severities, an increase of 6% on the previous year but a decline of 12% compared to 2019.
Overall statistics
| Killed | KSI | KSIA | All |
| 1,771 | 29,742 | 28,031 | 135,480 |
Vehicle miles driven
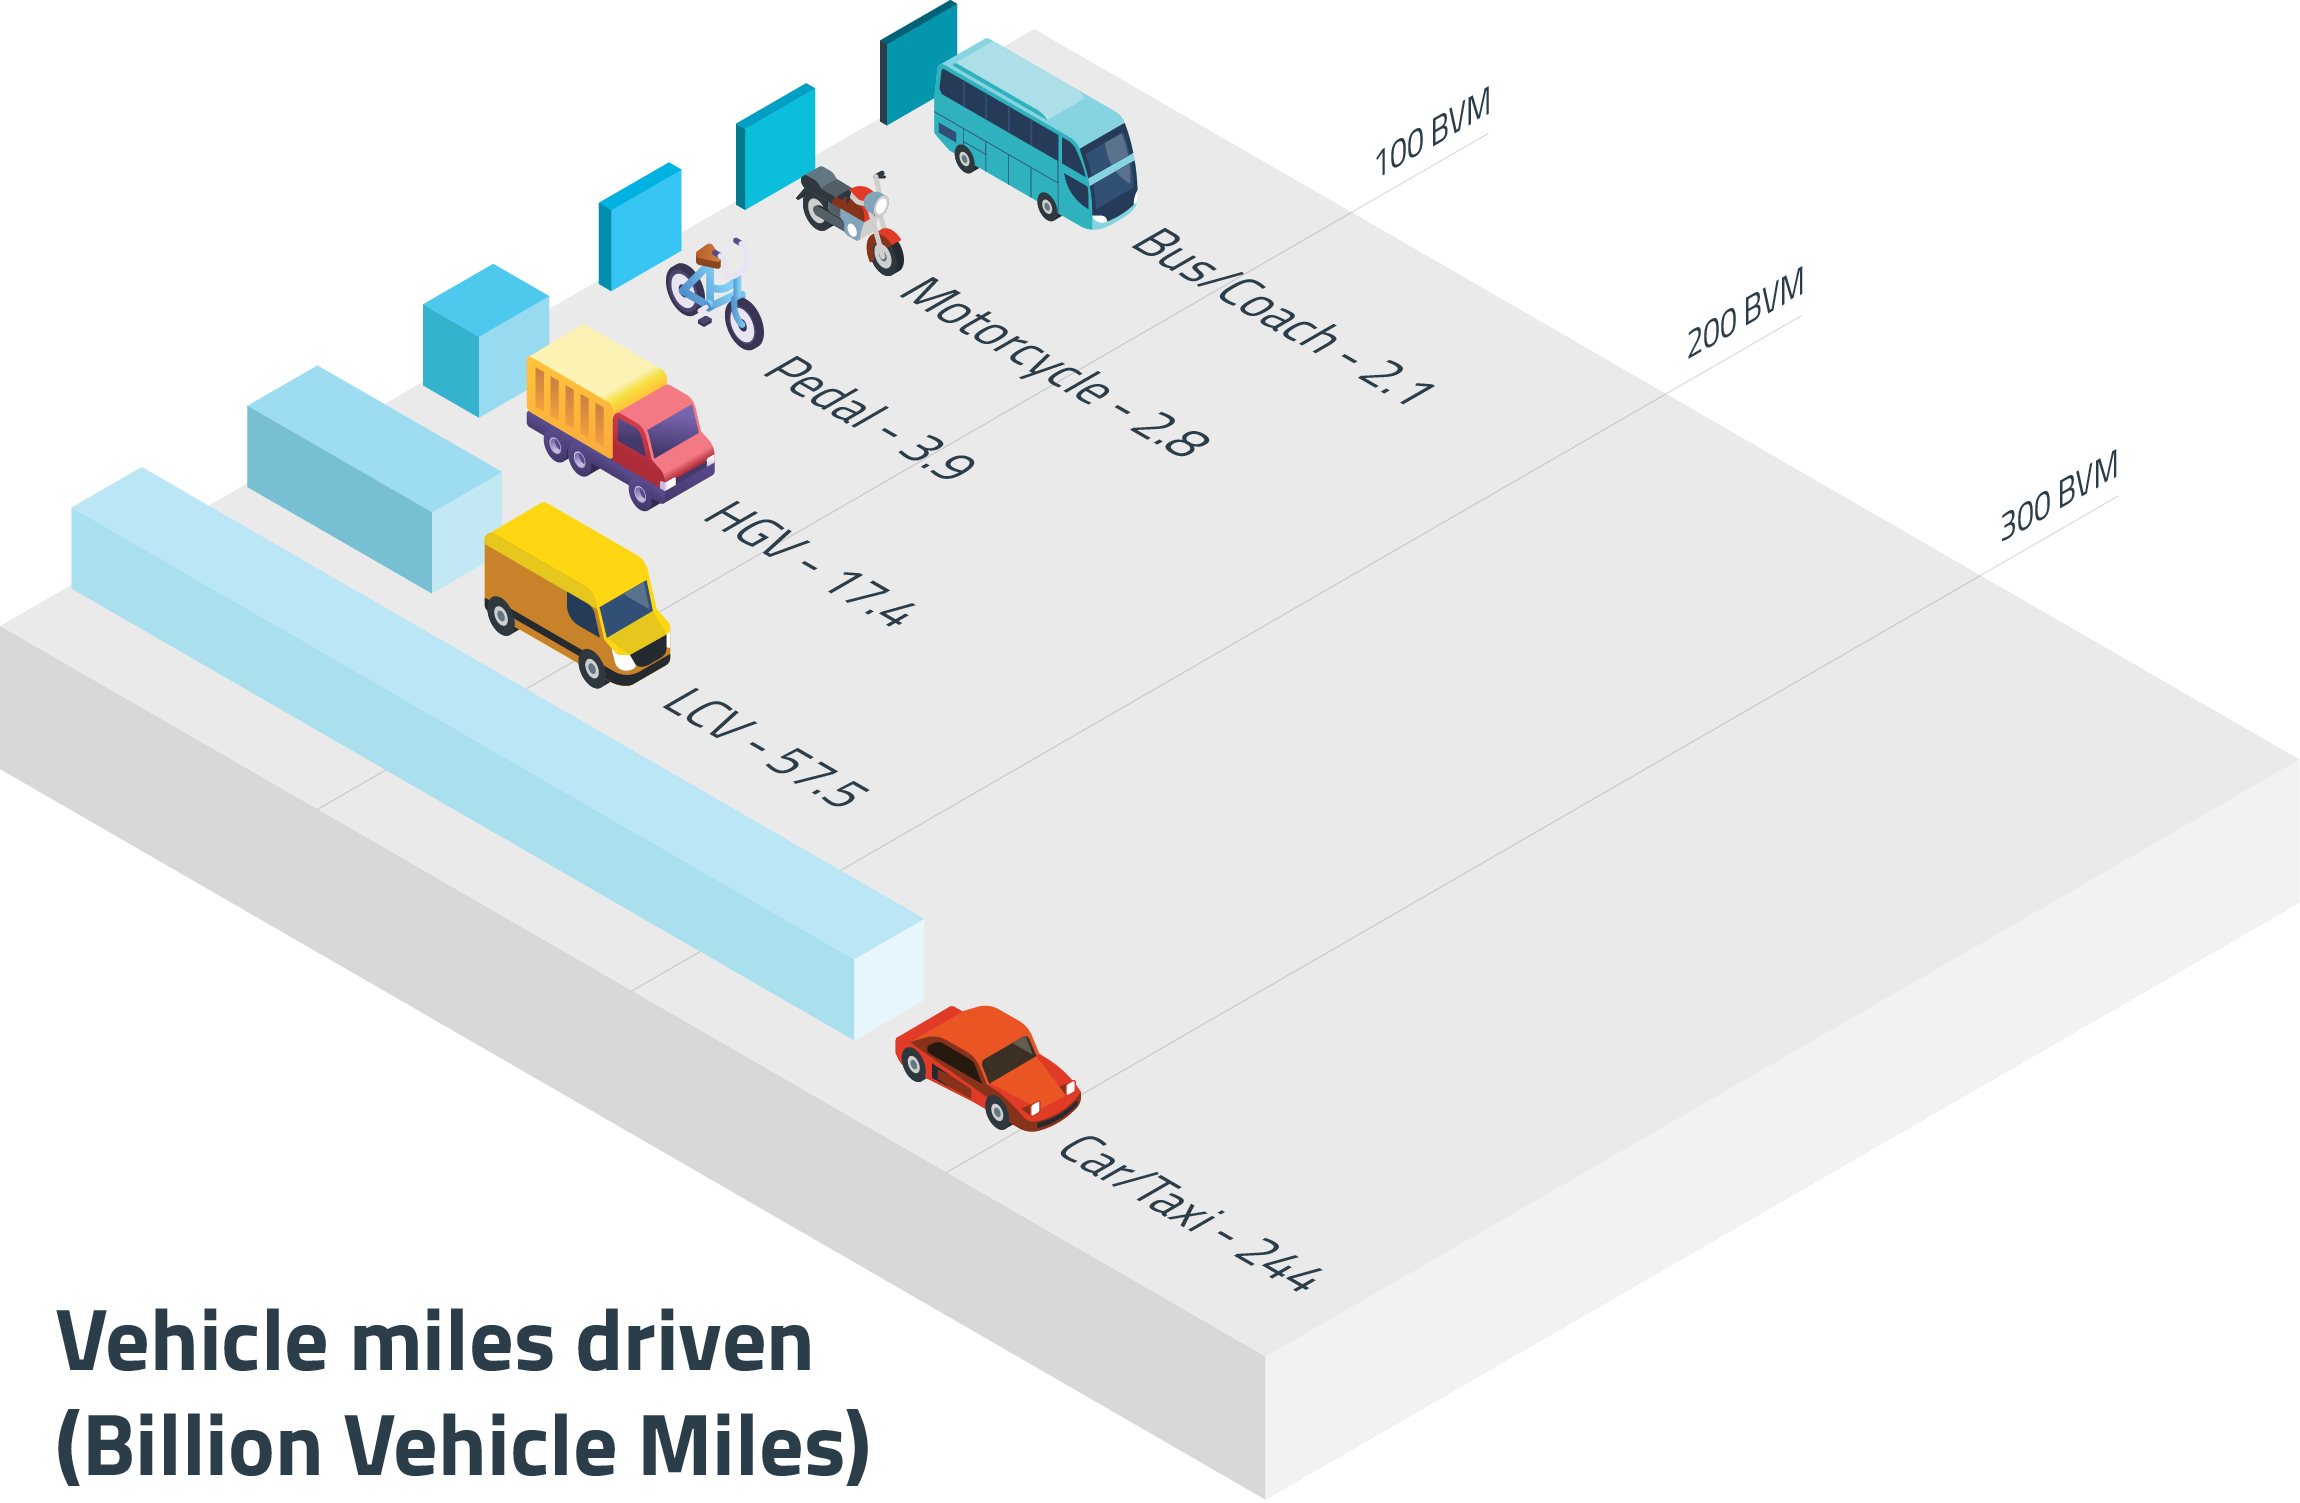
328 billion vehicle miles were travelled in 2022 (up from 297.6 billion vehicle miles in 2021 but still down 4% from 2019), so we are almost seeing a return to travel levels last seen before the COVID-19 pandemic. There were 5 road fatalities per billion vehicle miles travelled in 2022, up 2% compared to 2019.
Vehicle miles driven (BVM)
| Cars/Taxi | LCV | HGV | Pedal | Buses/Coach | Motorcycles |
| 244 | 57.5 | 17.4 | 3.9 | 2.1 | 2.8 |
Casualties by gender
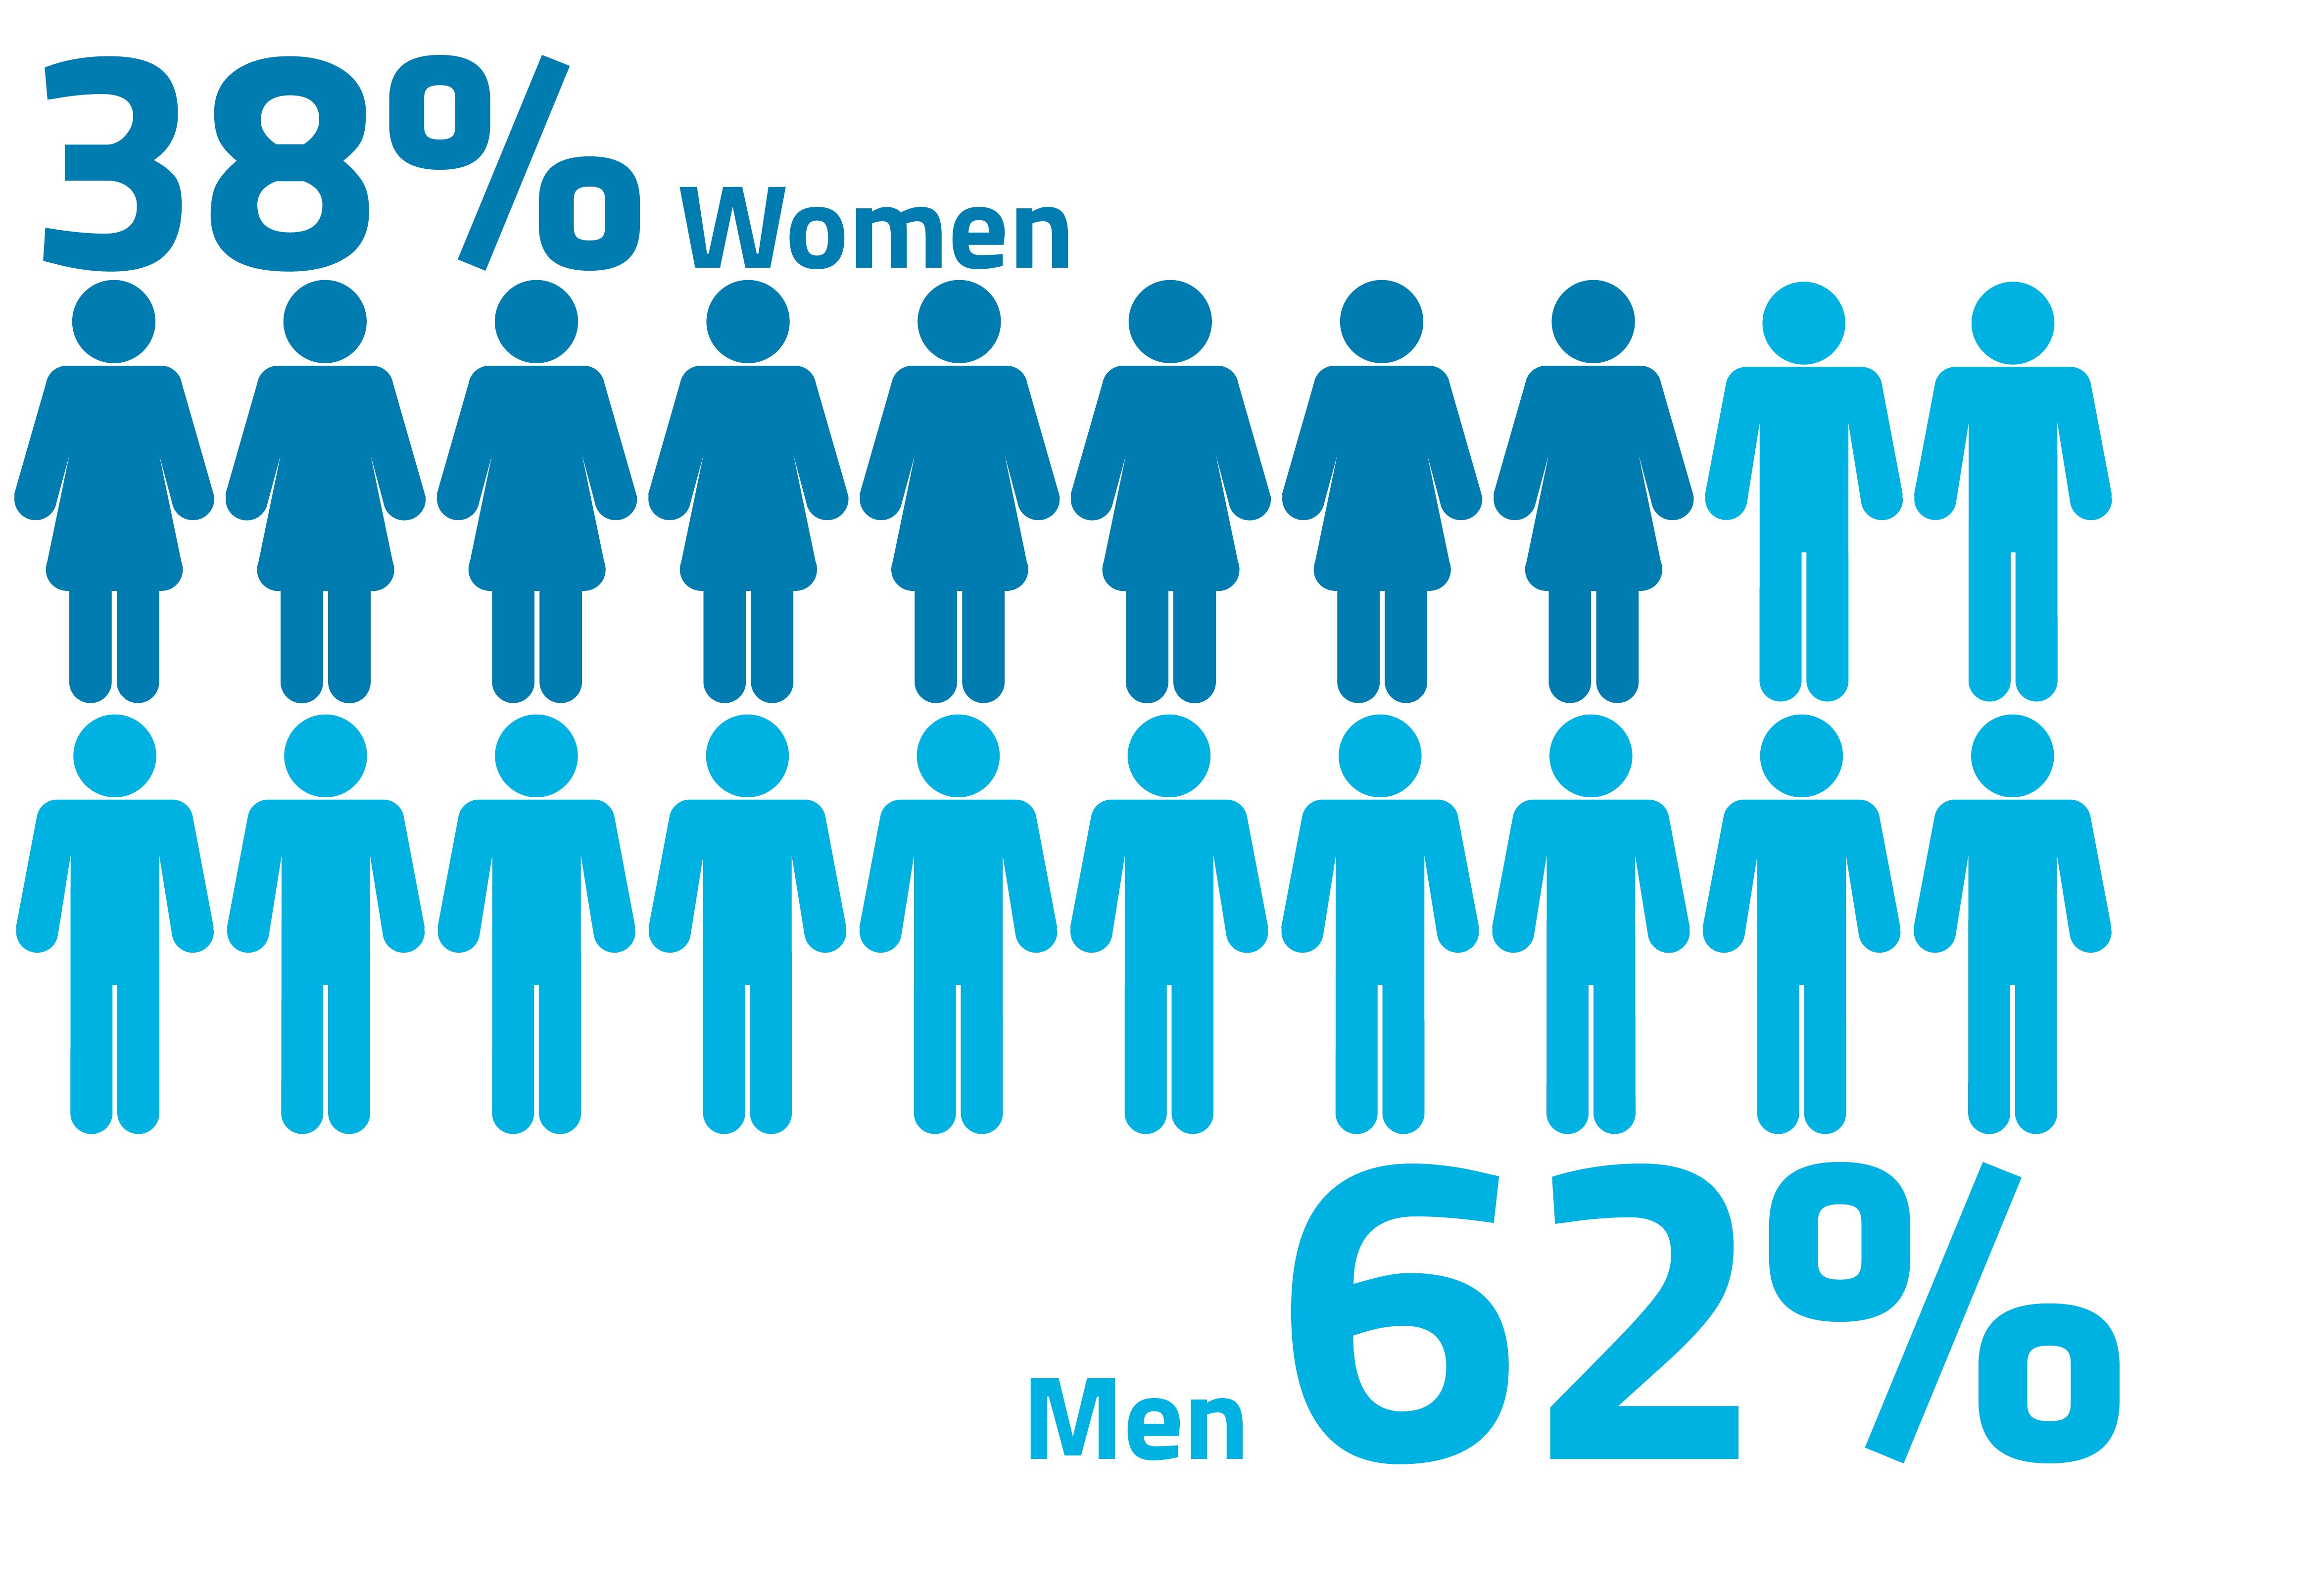
Male fatalities remain similar to those seen in 2019 whilst female fatalities have declined slightly. 76% of fatalities and 62% of casualties of all severities were male. In 2022, 1,292 males died on the roads compared to 419 females.
Casualties by gender
| Killed | KSI | KSIA | All | |
| Male | 1,292 | 18,783 | 8,348 | 82,746 |
| Female | 419 | 8,707 | 8,998 | 51,641 |
| Unknown | 41 | 44 | 1,093 |
Casualties by age
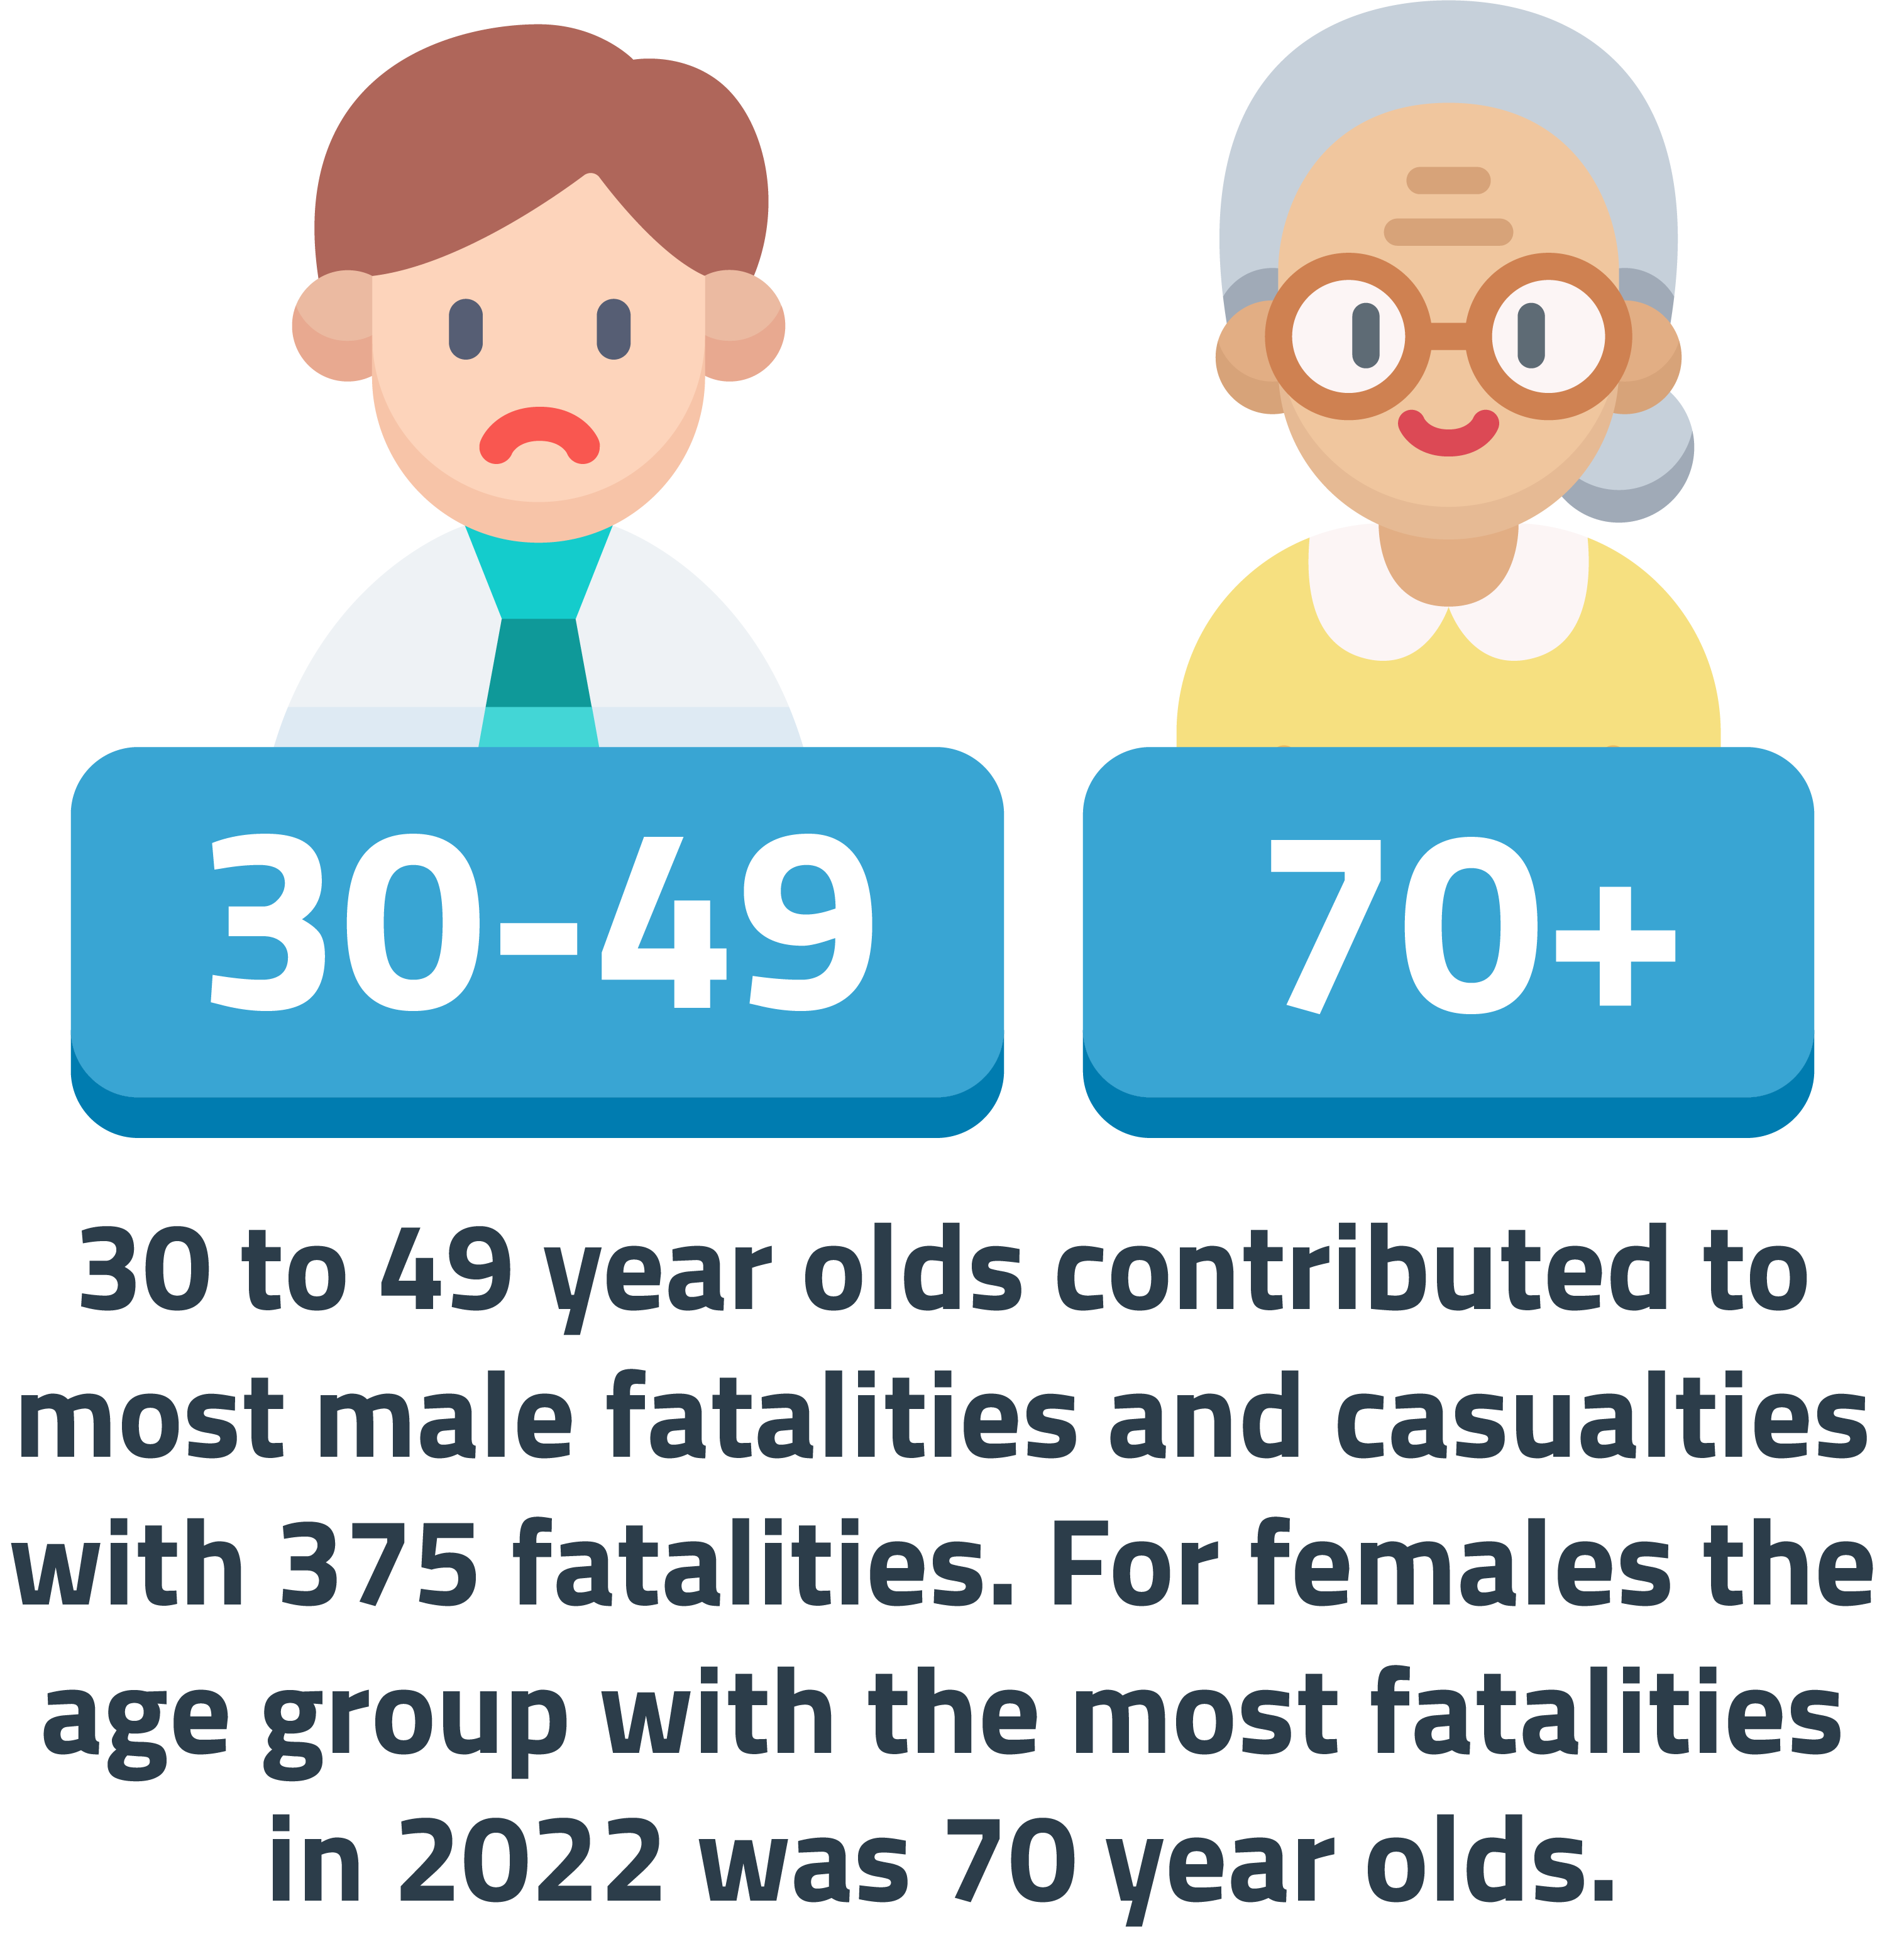
In 2022, the age group with the most male fatalities was 30 to 49-year-olds with 375 fatalities, which was little changed compared to 2019. For females, the age group with the most fatalities in 2022 was 70-year-olds and over with 153 fatalities, a decline of 17% compared to 2019.
In 2022, the age group with the most male casualties was 30 to 49-year-olds with 27,486 casualties. For females, the 30 to 49 year old age group also had the most casualties in 2022 with 16,276 casualties.
Casualties by age
| <16 | 16 | 17-20 | 21-24 | 25-29 | 30-39 | 40-49 | 50-59 | 60-69 | 70+ | |
| Killed | 49 | 8 | 157 | 128 | 136 | 263 | 200 | 196 | 182 | 392 |
| KSI | 2,247 | 351 | 2,722 | 2,245 | 2,561 | 4,554 | 3,320 | 3,643 | 2,574 | 2,885 |
| KSIA | 2,450 | 382 | 2,963 | 2,424 | 2,759 | 4,898 | 3,582 | 3,934 | 2,778 | 3,112 |
| All | 11,821 | 1,537 | 12,534 | 11,764 | 14,465 | 25,464 | 18,516 | 16,745 | 9,760 | 9,745 |
Casualties by road type
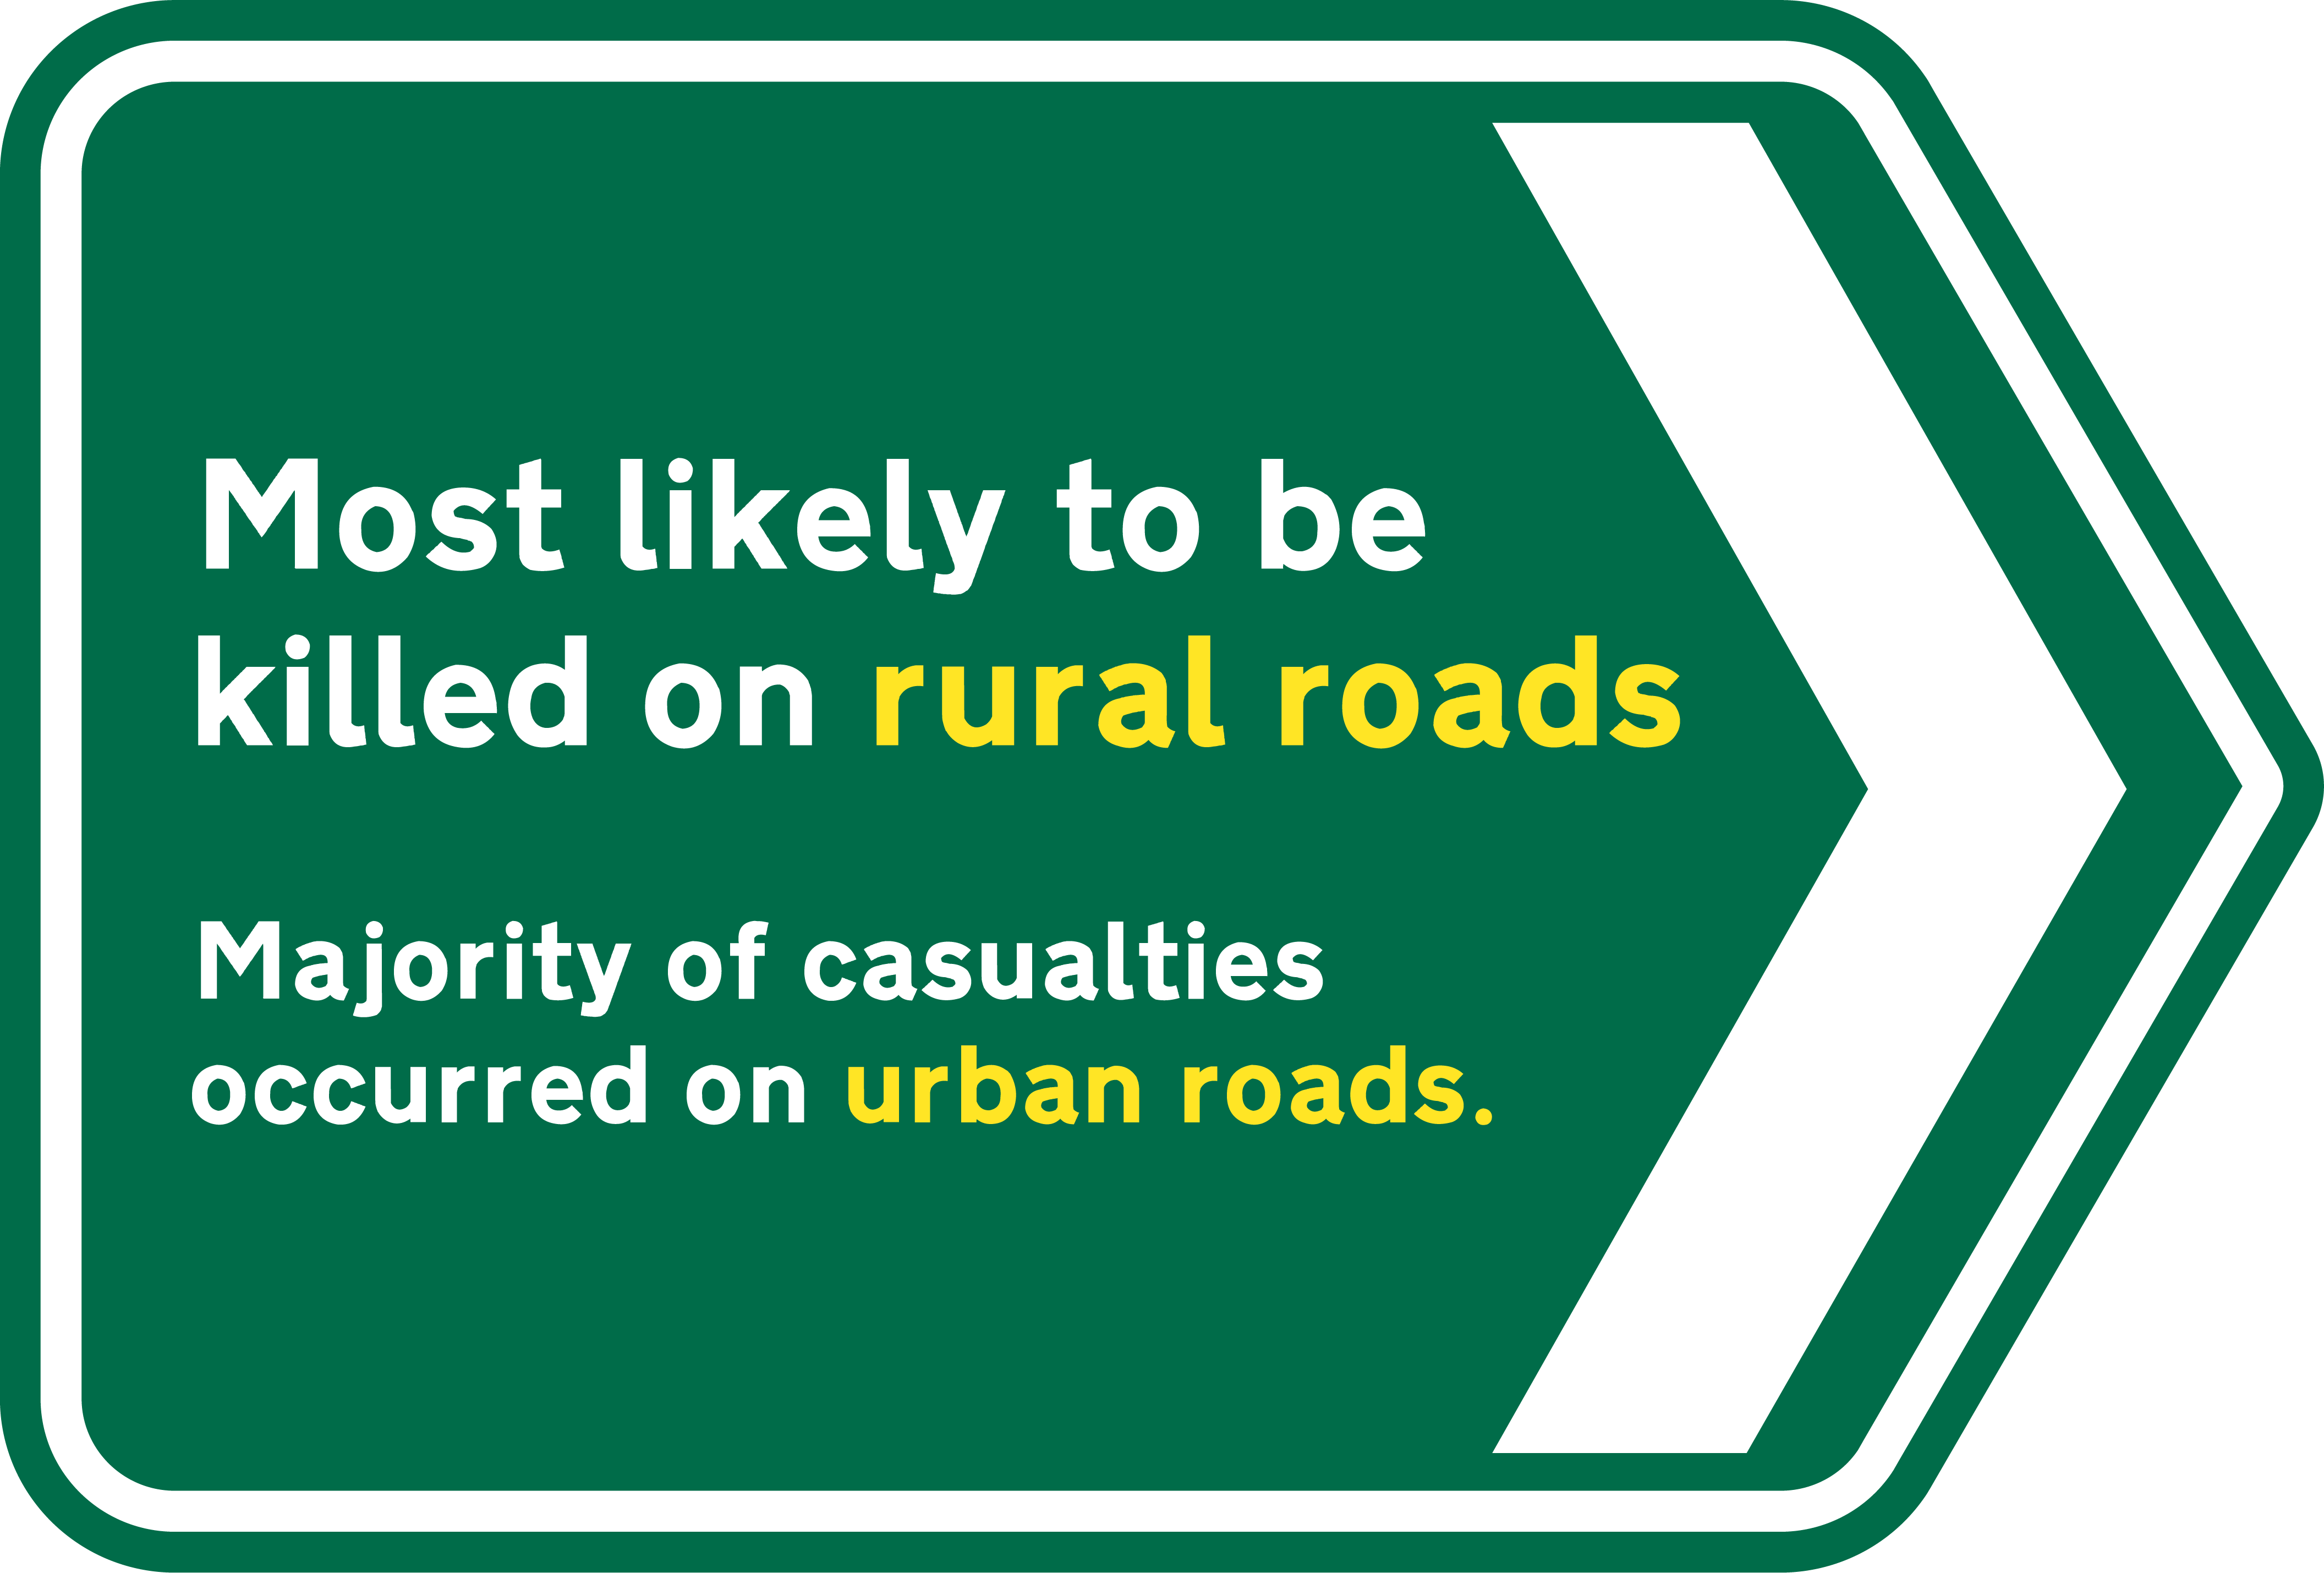
In 2022, the majority of road fatalities occurred on rural roads, whereas the majority of all casualties occurred on urban roads. Although motorways account for 21% of road traffic, they account for a much smaller proportion of road fatalities (6%) and casualties (4%).
By contrast, rural road fatalities (59%) are overrepresented compared to the proportion of rural road traffic (44%). Similarly, urban roads account for a much higher proportion of road casualties (63%) than their relative traffic level (35%).
In 2022, the highest fatality rate was on rural roads with 7 people killed per billion miles travelled. This compares to 1 per billon miles travelled on motorways and 5 on urban roads.
Casualties by road type
| A | B | C | U | Motorway | A(M) | |
| Killed | 906 | 249 | 55 | 401 | 92 | 8 |
| KSI | 12,479 | 3,814 | 965 | 9,398 | 784 | 91 |
| KSIA | 13,402 | 4,166 | 1,116 | 10,172 | 840 | 96 |
| All | 61,432 | 16,856 | 5,625 | 46,258 | 4,851 | 458 |
Casualties by speed limit
Most deaths occurred on roads with 60 and 30 mph speed limits in 2022 – 544 and 532 respectively – accounting for 63% of fatalities. 20mph limits were the location for 68 deaths, up from 53 deaths in 2021, a 28% increase.
50mph roads, saw 161 fatalities (up from 115) fatalities and there were 69,737 total casualties in 30mph limits (also up from 67,715).
Casualties by speed limit
| 1-20 mph | 21-30 mph | 31-40 mph | 41-50 mph | 51-60 mph | 61-70 mph | Motorway | |
| Killed | 68 | 532 | 170 | 161 | 544 | 136 | 100 |
| KSI | 3,148 | 13,331 | 2,576 | 1,526 | 5,166 | 909 | 875 |
| KSIA | 3,260 | 14,422 | 2,785 | 1,660 | 5,685 | 994 | 936 |
| All | 18,453 | 69,727 | 12,449 | 6,440 | 18,535 | 4,567 | 5,309 |

Seat belt fatalities
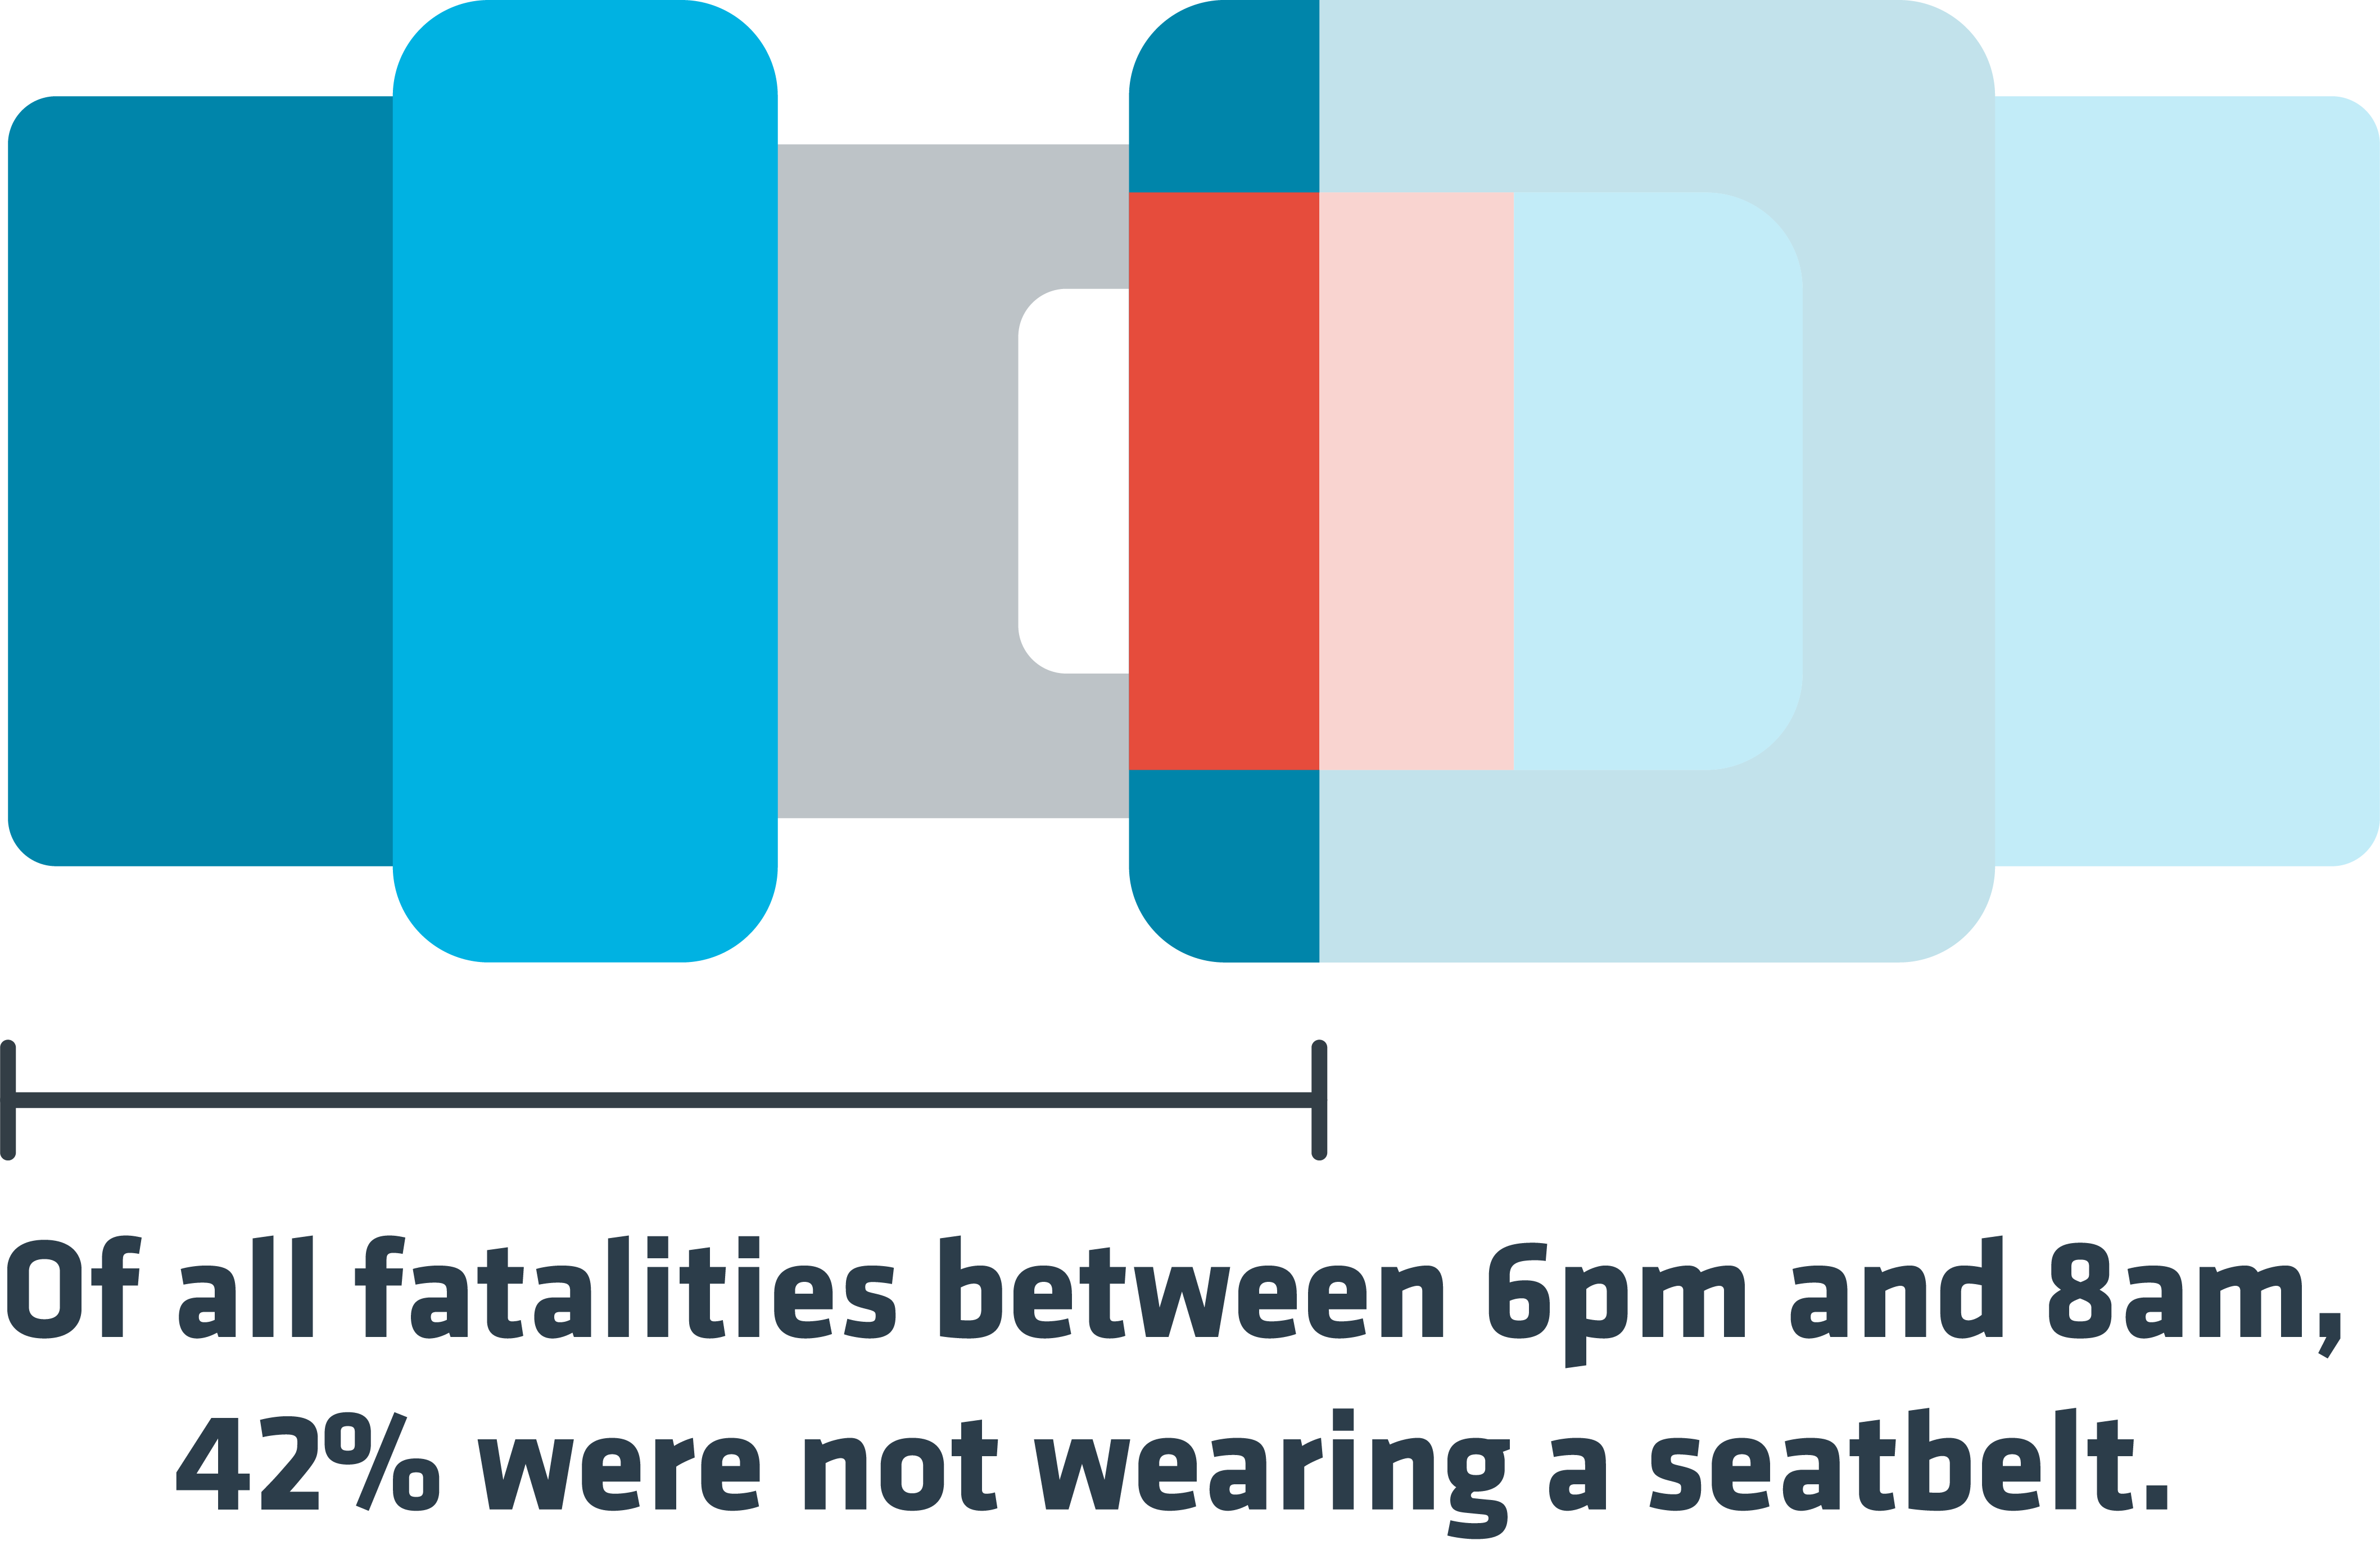
A fifth of all car occupants killed in 2022 were not wearing a seatbelt. 26% of men and 10% of females were not wearing a seatbelt. 17-29-year-olds remain the worst offenders with 30% of fatalities not wearing a seatbelt (although this is a 10% reduction from 2021). You are most likely to die in a crash between 6pm and 8am if you are not wearing a seatbelt (42%).
Seat belt fatalities
| Male | Female |
| 27% | 10% |
| 0-16 | 17-29 | 30-59 | 60+ |
| 15% | 30% | 29% | 9% |
| Daytime (8am to 6pm) | Night-time (6pm to 8am) |
| 11% | 42% |
Fatalities by location
Fatality rates are broadly similar across the UK although slightly higher in the East Midlands and Yorkshire and Humber. England saw an 8% increase in deaths on the road in 2022 compared to the previous year. 1443 people were killed and there were over 125,000 total casualties (6% increase).
In Scotland, there was a large increase in number killed on the road with 173 fatalities (up from 143 in 2021) marking a 21% increase. There were 5611 total casualties in 2022 up by 10%.
Wales saw a 10% increase in fatalities up from 86 to 95 in 2022.
Looking at England, the Southeast had the most road deaths with 249, followed by the East of England with 206. However, London saw the greatest number of overall casualties with 27,259. The Northeast had the lowest number of fatalities with 54, and 4160 total casualties; 84% less than London. View the full breakdown by region below:
Fatalities by location
| Killed | KSI | KSIA | All | |
| England | 1,329 | 24,570 | 26,461 | 125,424 |
| Scotland | 173 | 1,945 | 1,945 | 5,611 |
| Wales | 95 | 1,016 | 1,336 | 4,445 |
| Killed | KSI | KSIA | All | |
| East Midlands | 175 | 2,172 | 2,687 | 9,948 |
| East of England | 206 | 2,829 | 2,829 | 13,764 |
| London | 103 | 3,967 | 3,967 | 27,259 |
| Northeast | 54 | 942 | 997 | 4,160 |
| Northwest | 173 | 3,029 | 3,336 | 13,352 |
| Southeast | 249 | 4,409 | 4,970 | 22,110 |
| Southwest | 157 | 2,139 | 2,494 | 11,704 |
| West Midlands | 163 | 2,026 | 2,026 | 10,677 |
| Yorkshire and the Humber | 163 | 3,057 | 3,153 | 12,450 |

Contributory Factors
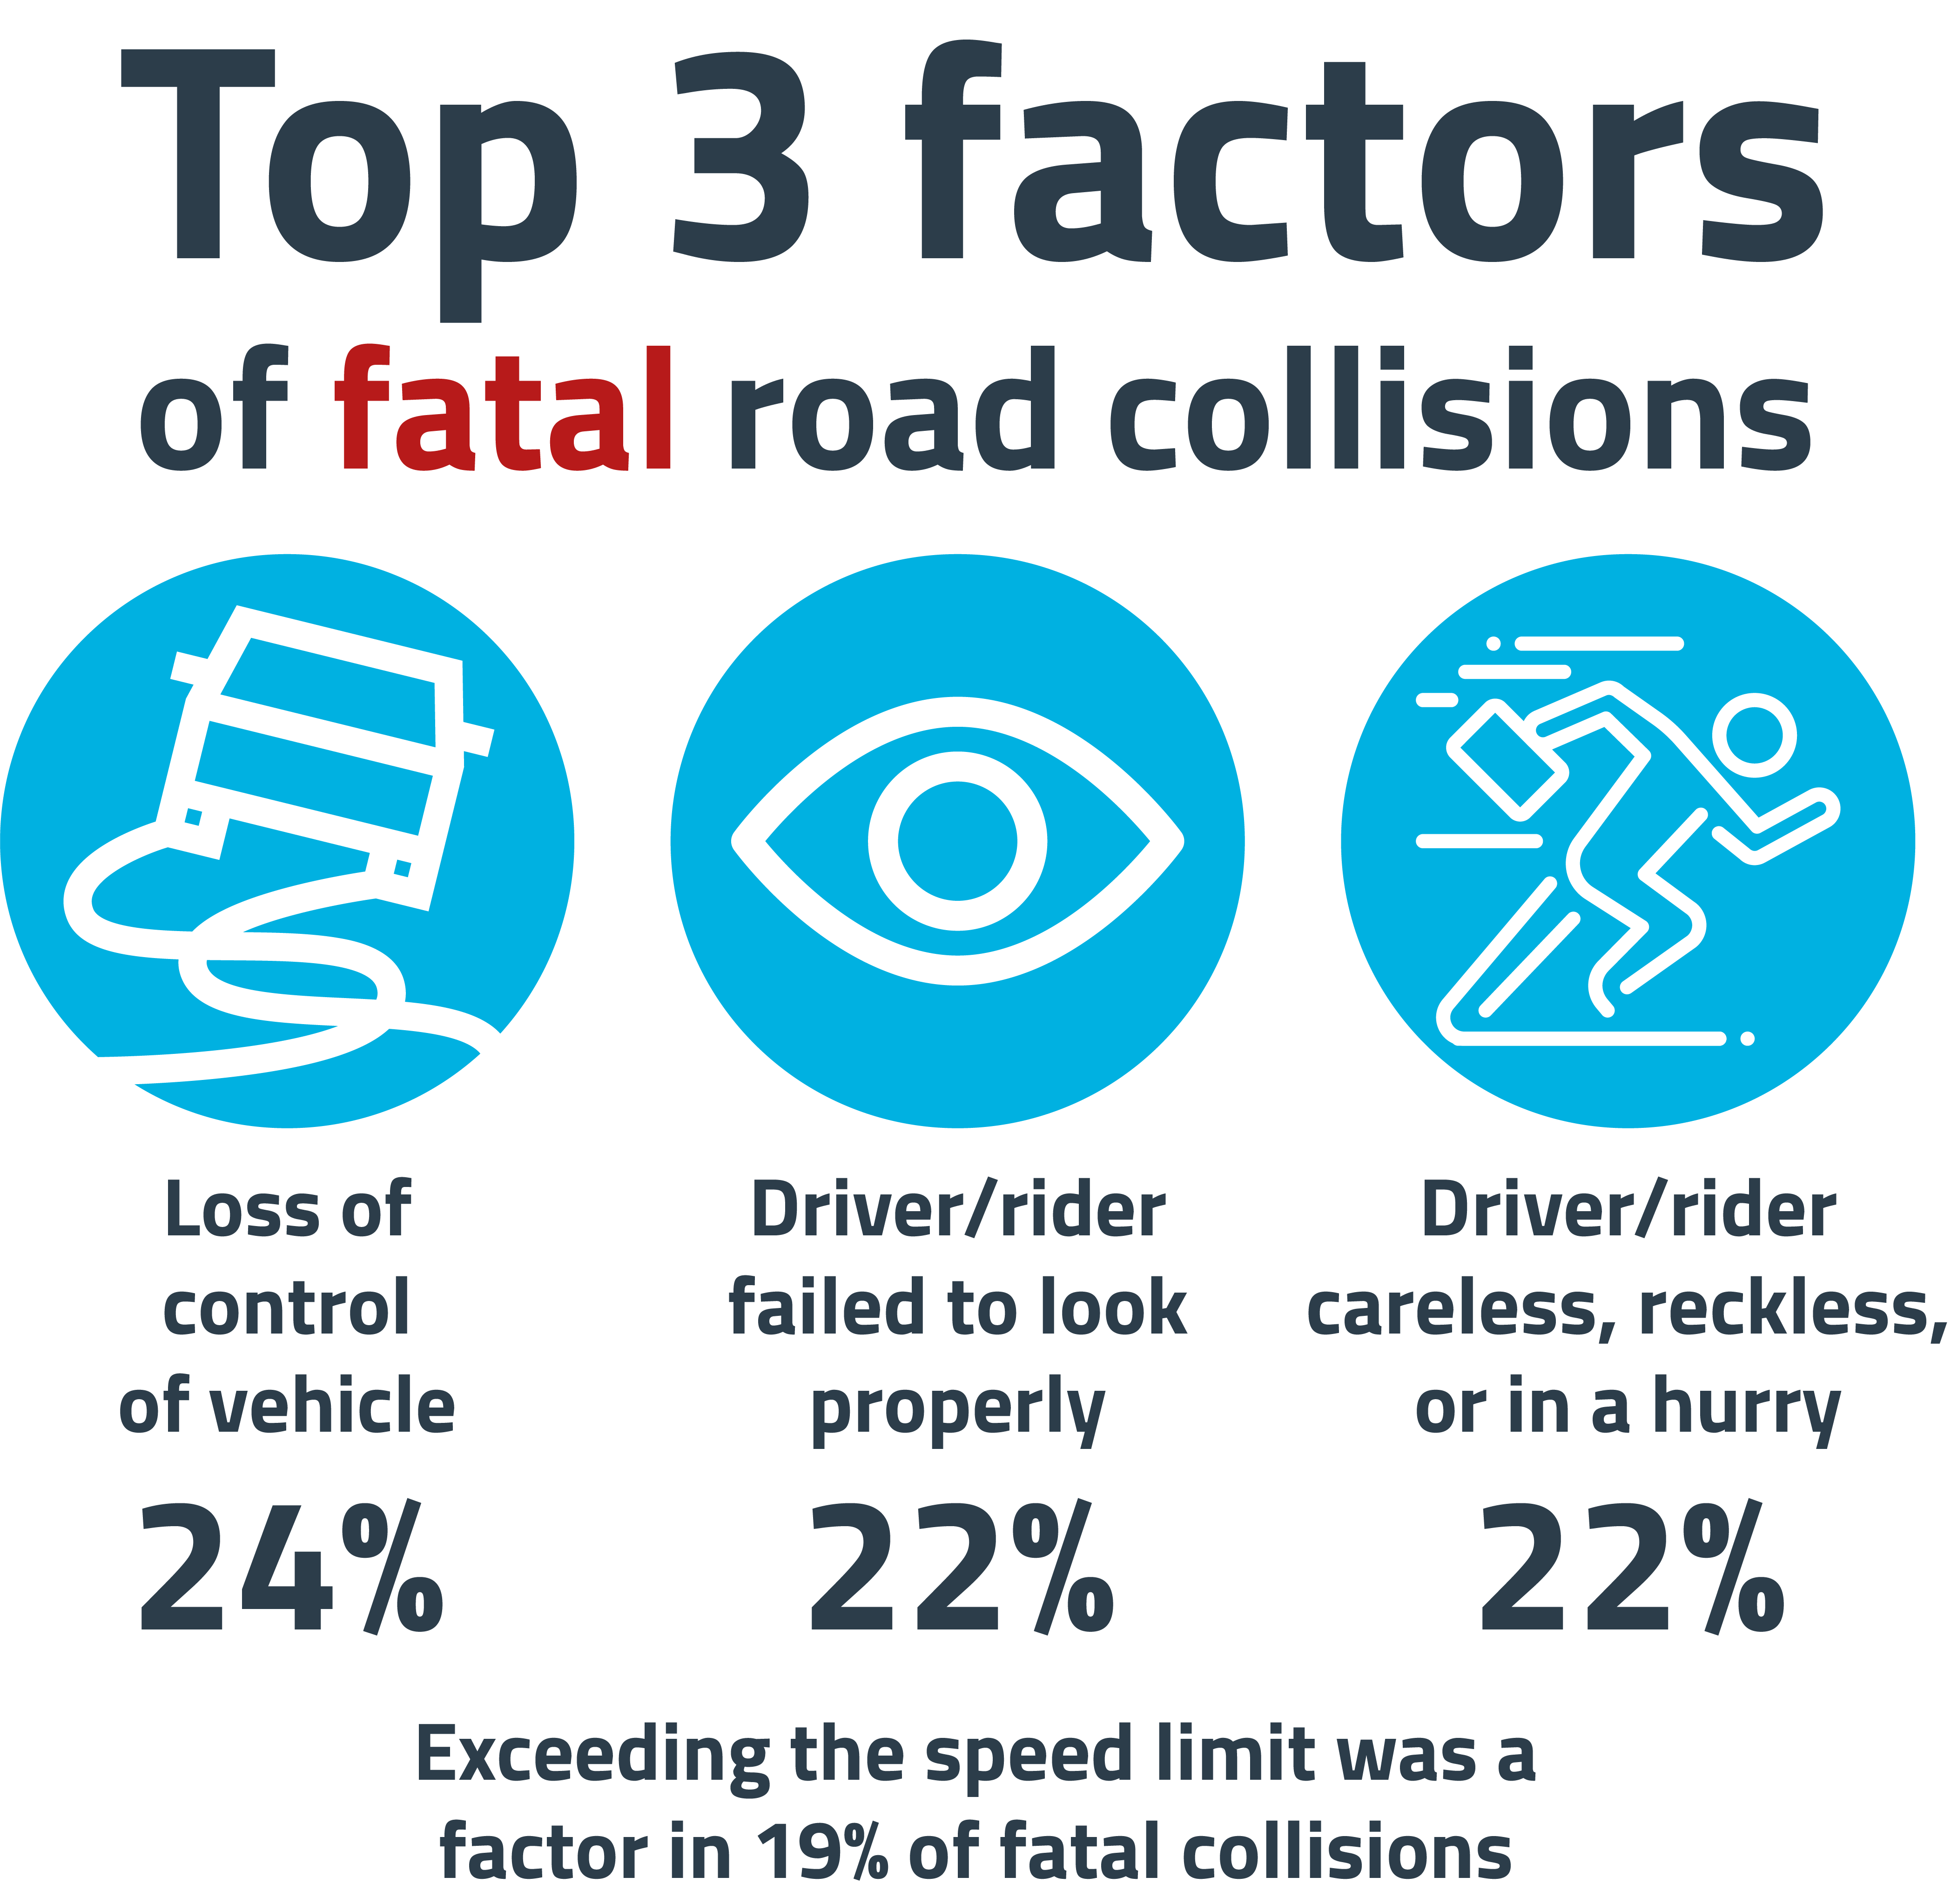
Similar to previous years, in 2022, the top 3 contributory factors assigned to fatal road collisions in Great Britain were:
1. Loss of control (24%)
2. Driver or rider failed to look properly (22%)
3. Driver or rider careless, reckless, or in a hurry (22%)
Exceeding the speed limit was a factor in 19% of fatal collisions.
The Hierarchy of Road Users
Pedestrian Priority
Cyclists and Roundabouts
The 'Dutch Reach'
Sharing with Cyclists
Sitting Comfortably
Driving in Towns
Motorway Driving
Understanding the Hierarchy of Road Users
Observation, Anticipation and Planning
How To Effectively Manage Distractions
Breaking the Cycle of Conflict
Understanding Stopping Distance